Leafletについて
Leafletは簡単に地図を描画できるライブラリです。
詳しくはこちらで紹介しています。
今回は、このLeafletでSVG要素を描画する方法を紹介します。
L.SVG
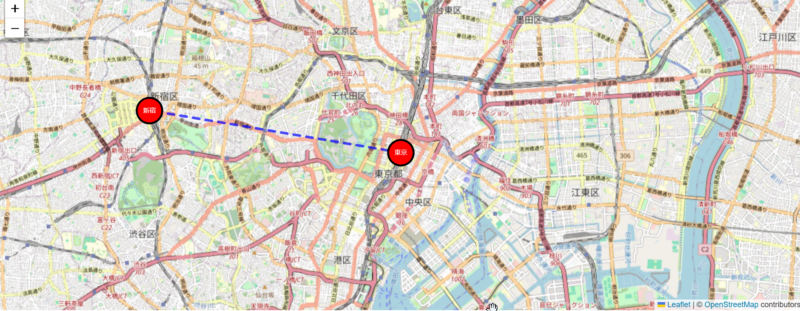
以下のHTMLは東京駅と新宿駅にマークをし、2駅を直線でつなぐ線を描画したHMTLです。
HTMLファイルにコードを書いて、表示できます。
<!DOCTYPE html>
<html lang="ja">
<head>
<meta charset="UTF-8">
<meta name="viewport" content="width=device-width, initial-scale=1.0">
<title>Leaflet SVG Example</title>
<link rel="stylesheet" href="https://unpkg.com/leaflet/dist/leaflet.css" />
<script src="https://unpkg.com/leaflet/dist/leaflet.js"></script>
<style>
/* 地図のサイズを指定 */
#map {
width: 100%;
height: 500px;
}
</style>
</head>
<body>
<div id="map"></div>
<script>
// 地図の初期化
var map = L.map('map').setView([35.681236, 139.767125], 13); // 東京駅の座標
// OpenStreetMapタイルを追加
L.tileLayer('https://{s}.tile.openstreetmap.org/{z}/{x}/{y}.png', {
attribution: '© <a href="https://www.openstreetmap.org/copyright">OpenStreetMap</a> contributors'
}).addTo(map);
// SVGアイコンを作成する関数
function createSVGIcon(label) {
return L.divIcon({
className: 'leaflet-zoom-animated',
html: `<svg width="50" height="50" viewBox="0 0 50 50" xmlns="http://www.w3.org/2000/svg">
<circle cx="25" cy="25" r="20" stroke="black" stroke-width="3" fill="red" />
<text x="25" y="25" font-size="10" text-anchor="middle" dy=".3em" fill="white">${label}</text>
</svg>`,
iconSize: [50, 50]
});
}
// 東京駅にマーカーを追加
var tokyoMarker = L.marker([35.681236, 139.767125], { icon: createSVGIcon('東京') }).addTo(map);
// 新宿駅にマーカーを追加
var shinjukuMarker = L.marker([35.6905, 139.6995], { icon: createSVGIcon('新宿') }).addTo(map);
// SVG線(ポリライン)を追加
var latlngs = [
[35.681236, 139.767125], // 東京駅
[35.6905, 139.6995] // 新宿駅
];
L.polyline(latlngs, {
color: 'blue',
weight: 4,
opacity: 0.7,
dashArray: '10,10'
}).addTo(map);
</script>
</body>
</html>

SVGのPathの場合
Path要素を追加することも可能です。
SVG要素を配置する範囲の左上と右下の緯度、経度を指定して、配置します。
<!DOCTYPE html>
<html lang="ja">
<head>
<meta charset="UTF-8">
<meta name="viewport" content="width=device-width, initial-scale=1.0">
<title>Leaflet SVG Path Example</title>
<link rel="stylesheet" href="https://unpkg.com/leaflet/dist/leaflet.css" />
<script src="https://unpkg.com/leaflet/dist/leaflet.js"></script>
<style>
/* 地図のサイズを指定 */
#map {
width: 100%;
height: 500px;
}
/* SVG要素のデザインを調整 */
#custom-svg path {
stroke: blue;
stroke-width: 10;
fill: none;
}
</style>
</head>
<body>
<!-- 地図を表示する領域 -->
<div id="map"></div>
<!-- SVG要素を事前に定義 -->
<svg id="custom-svg" xmlns="http://www.w3.org/2000/svg" width="600" height="400" viewBox="0 0 600 400">
<path d="M0 0 C150 150, 1450 150, 1000 40" />
</svg>
<script>
// 地図の初期化
var map = L.map('map').setView([35.681236, 139.767125], 13); // 東京駅の座標
// OpenStreetMapタイルを追加
L.tileLayer('https://{s}.tile.openstreetmap.org/{z}/{x}/{y}.png', {
attribution: '© <a href="https://www.openstreetmap.org/copyright">OpenStreetMap</a> contributors'
}).addTo(map);
// HTML側で定義したSVGを取得
var svgElement = document.getElementById('custom-svg');
// 地理的範囲(東京駅と新宿駅)
var bounds = [[35.681236, 139.767125], [35.6895, 139.6917]];
// SVGオーバーレイを地図に追加
L.svgOverlay(svgElement, bounds).addTo(map);
</script>
</body>
</html>


